I have SoapUI Pro from SmartBear at my disposal at work, and I’m quite comfortable with it. So it was my tool of choice for creating load and recording details about the results.
SoapUI’s first cousin LoadUI, a free version of which comes with the SoapUI Pro install, was also an option. However, I chose not to explore it for this testing mission. (A road not travelled, admittedly.)
My first load tests sent requests to the middleware Web services described in Part 3 of this series. Because of our NTLM proxy at work I had to use Fiddler to do the handshake between my desktop and the Web services.
Fiddler records a lot of interesting information about Web service requests, including response times and bytesize. So I copied that data from Fiddler, pasted it into Excel, and created time-series graphs from that data. I was able to create some pretty graphs, but copying and pasting the data over and over got to be a real time sink. I am not and will never be a VBA whiz, so I knew I had to find a better way.
I was forced into finding that better way when it came time to test the performance of the .NET services that USED the middleware Web services. Because of the .NET Web server’s configuration, I could no longer route requests through Fiddler and see the data. What seemed to be a hindrance turned out to be a blessing in disguise.
The solution I arrived at was to use SoapUI to record several aspects of the request and response transactions to a flat file. I could then bring that flat file into R for graphing and analysis.
The SoapUI test case for the .NET services is set up as follows. Apologies for the blurriness of some images below: I haven’t done HTML-based documentation in quite some time.
- Initial request to get the service “warmed up.” I do not count those results.
- Multipurpose Groovy script step.
- Run a SQL query in a JDBC DataSource step to get a random policy number from the database of your choice on the fly. You can create your SQL query for the DataSource step dynamically in a Groovy script.
- Here’s the JDBC data source for the policy numbers.The query (not shown) is fed over from the preceding Groovy script step.
- I feed the value of PolicyNumber returned by the SQL query to my SOAP request via a property transfer.
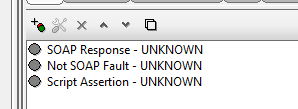
- I have a few assertions in the SOAP request test step. The first two are “canned” assertions that require no scripting.
- Another Groovy script step to get the size in bytes of the response:
- Yet another Groovy script step to save responses as XML in a data sink, with policy number, state code, and active environment as the filename:
- Some property transfers, including a count of policy terms (see part 3 of this series) in the response:
- DataSink to write the response XML to a file. The filename is set in step 7 above.
- DataSink to write information relevant to performance to a CSV whose name is set on the fly. The filenames and property values come from the steps above.
- Don’t forget a delay step if you’re concerned about overloading the system. (Note that you can configure delays and threading more precisely in LoadUI. This test case, like all SoapUI test cases that aren’t also LoadTests, is single-threaded by default.)
- And of course a DataSource Loop.
- The whole test case looks like this:
- And now I have a CSV with response times, bytesizes, policy risk states, and term counts to parse in the tool of my choice. I chose R. More about that later.
// I am registering the jTDS JDBC driver for use later in the test case. See below for info on using third-party libraries.
import groovy.sql.Sql
com.eviware.soapui.support.GroovyUtils.registerJdbcDriver( "net.sourceforge.jtds.jdbc.Driver" )
//Get the time now via Joda to put a time stamp on the data sink filename.
import org.joda.time.DateTime
import org.joda.time.LocalDate
def activeEnvironment = context.expand( '${#Project#activeEnvironment}' )
def now = new DateTime().toString().replaceAll("[\\W]", "_")
// Construct the file name for response data and set the filename value of a Data Sink set further along in the test.
testRunner.testCase.getTestStepByName("Response Size and Time Log").getDataSink().setFileName('''Q:/basedirectory/''' + activeEnvironment + '''_''' + now + '''_responseTimes.csv''')
If your Groovy script uses third-party libraries like jTDS and Joda, you have to put the jar files into $soapui_home/bin/etc.
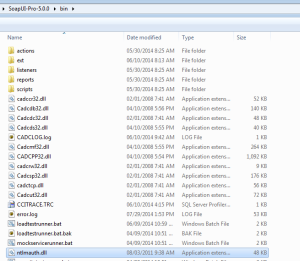
Note that jTDS has an accompanying DLL for SQL Server Windows-based authentication. DLLs like this go in $soapui_home/bin.
This is how you set an activeEnvironment variable: setup happens at the project level:
Then you choose your environment at the test suite level.
// State Codes is a grid Data Source step whose contents aren't shown here.
def stateCode = context.expand( '${State Codes#StateCode}' )
testRunner.testCase.getTestStepByName("Get A Policy Number").getDataSource().setQuery("SELECT top 1 number as PolicyNumber FROM tablename p where date between '1/1/2012' and getdate() and state = '" + stateCode + "' order by newid()")
You will have to set your connection properties. Your connection string for jTDS might look something like this. For more information about jTDS, see the online docs.
jdbc:jtds:sqlserver://server:port/initialDatabase;domain=domainName;

trusted_connection=yes

The third SOAP request assertion, which is more of a functional script than it is an assertion, captures the timestamp on the response as well as the time taken to respond. These are built-in SoapUI API calls. The properties TimeStamp and ResponseTime are created and initialized in this Groovy script – I didn’t have to create them outside the script (for example, at the test step level).
import org.joda.time.DateTime
targetStep = messageExchange.modelItem.testStep.testCase.getTestStepByName('Response Size and Time Log')
targetStep.setPropertyValue( 'TimeStamp', new DateTime(messageExchange.timestamp).toString())
targetStep.setPropertyValue( 'ResponseTime', messageExchange.timeTaken.toString())
def responseSize = context.expand( '${Service#Response#declare namespace s=\'http://schemas.xmlsoap.org/soap/envelope/\'; //s:Envelope[1]}' ).toString()
responseSize.length()
def policyNumber = context.expand( '${Service#Request#declare namespace urn=\'urn:dev.null.com\'; //urn:Service[1]/urn:request[1]/urn:PolicyNumber[1]}' )
def stateAbbrev = context.expand( '${Service#Response#declare namespace ns1=\'urn:dev.null.com\'; //ns1:Service[1]/ns1:Result[1]/ns1:State[1]/ns1:Code[1]}' )
def activeEnvironment = context.expand( '${#Project#activeEnvironment}' )
testRunner.testCase.getTestStepByName("DataSink").getDataSink().
setFileName('''B/basedirectory/''' + policyNumber + '''_''' + stateAbbrev
+ '''_''' + activeEnvironment + '''.xml''')


